Texas HD-124 Press Release
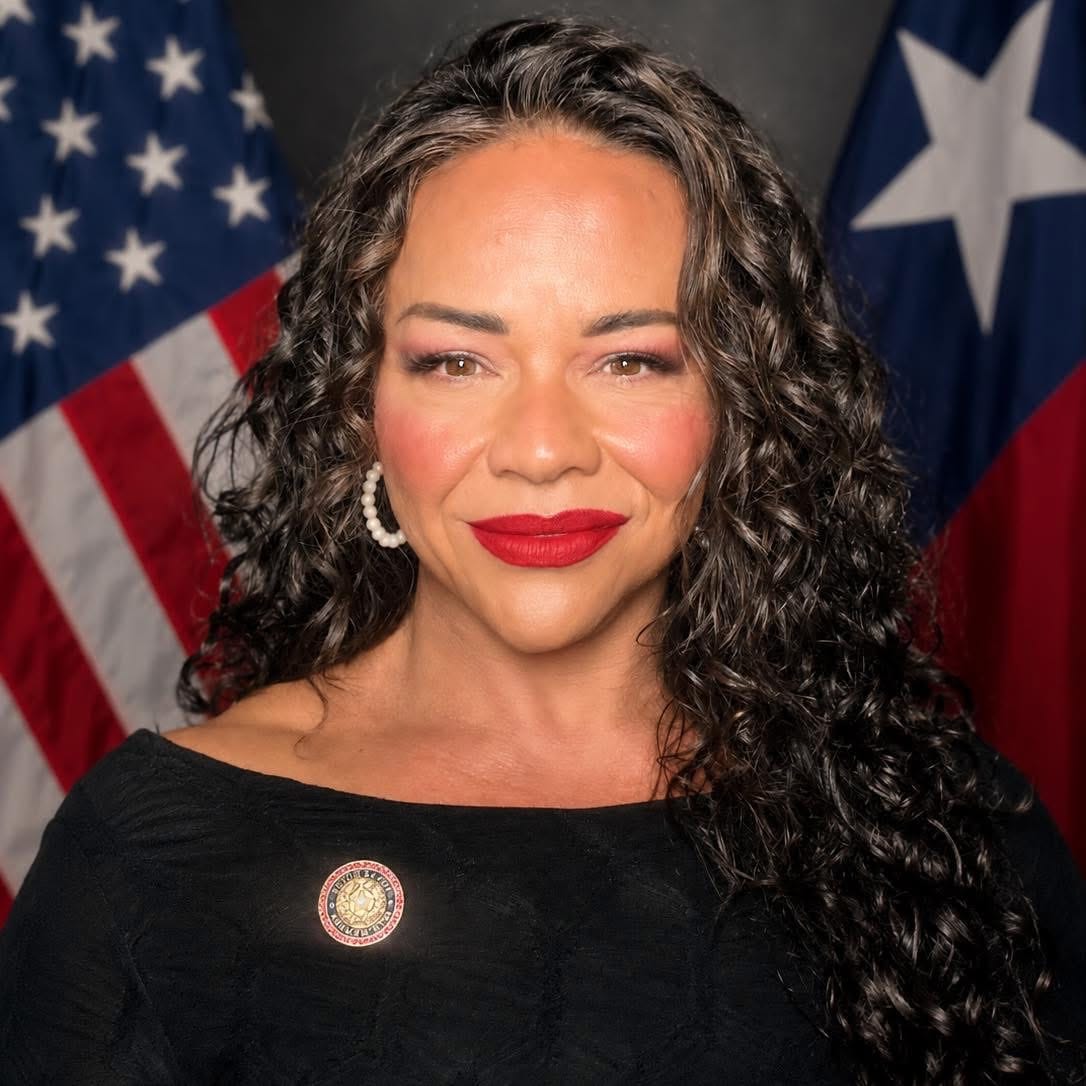
Bexar County’s Foster-Care Data Points to a Question of Scale, Capacity and Support
Rep. Josey Garcia is reviewing new federal and Texas child-welfare data ahead of the next legislative session, looking for where policy, funding and stronger caregiver support could improve stability for children and families.
Bexar County stands out nationally for the number of children included in a Census household category that covers foster children and other unrelated children. But a second ranking tells a different story: Bexar does not stand out nationally for the share of children in that category.
That distinction is central to how State Rep. Josey Garcia is approaching the data. Rather than declaring a crisis from a single ranking, Garcia is using the numbers to ask what a county of Bexar’s size requires from Texas when thousands of children, caregivers, providers, caseworkers, schools and community organizations interact with formal and informal systems of care.
“When I look at these numbers, my first question is not who to blame. My first question is what do they mean for the children, the families and the people who are trying to care for them — and what can we do in the Legislature to make the system stronger?” State Rep. Josey Garcia, Texas House District 124
Bexar is one of the nation’s largest counties by estimated count
The 2024 American Community Survey five-year estimate places 7,480 children in Bexar County in the combined relationship category “foster child or other unrelated child.” That is the 15th-highest published county estimate among 3,222 U.S. counties and county equivalents and the third-highest among Texas counties.
The estimate has a margin of error of approximately ±1,306, with a relative margin of error of about 17.5%. Under the National Data System’s current reliability rules, that county estimate is classified as HIGH reliability.
| Texas Rank | County | ACS Estimate | Margin of Error | Reliability |
|---|---|---|---|---|
| 1 | Harris | 17,093 | ±2,403 | HIGH |
| 2 | Tarrant | 7,647 | ±1,188 | HIGH |
| 3 | Bexar | 7,480 | ±1,306 | HIGH |
| 4 | Dallas | 7,446 | ±1,218 | HIGH |
| 5 | Travis | 3,582 | ±824 | HIGH |
The share ranking changes the interpretation
The same Census data can be viewed as a share of children in the B09018 household universe. Bexar’s combined-category estimate represents approximately 1.47% of that universe. Its derived share has a margin of error of approximately ±0.257 percentage points and is also classified as HIGH reliability.
But Bexar ranks only about 1,795th of 3,222 U.S. counties and county equivalents by share. In other words, Bexar is not unusually high once the size of its child household population is considered.
DFPS data raises a second set of questions
Census household estimates are only one part of the picture. Texas Department of Family and Protective Services administrative data separately shows substantial changes in Bexar County’s formal foster-care system.
Average monthly unique children and youth in paid foster care declined from 2,024 in FY2021 to 1,149 in FY2025 — a decrease of 875, or approximately 43.2%. That decline could reflect positive developments such as fewer removals, stronger family preservation, faster reunification or other permanency outcomes. It could also reflect changes in placement classifications, provider capacity, payment policies, Community-Based Care implementation or reporting practices.
Garcia has said the data should prompt questions rather than conclusions, particularly because portions of the period overlap the COVID-19 public-health emergency and recovery years, when courts, agencies, schools, providers and local governments operated under extraordinary conditions.
Sibling placement is emerging as a legislative concern
The Bexar County sibling-placement data presents another issue Garcia wants to understand before the next session. For FY2025, the current backbone reports 463 sibling groups across the available placement categories: 270 groups were reported as placed together and 193 were reported as not placed together.
Those figures do not reveal why individual siblings were separated. Safety needs, treatment requirements, court decisions and different levels of care may all play a role. Garcia’s policy question is whether some separations also reflect a shortage of homes able to accept larger sibling groups or insufficient support for caregivers willing to do so.
What Garcia is considering before the next session
Sibling Preservation
Better information on reasons for separation, duration, visitation, placement distance and capacity for larger sibling groups.
Kinship and Caregiver Stability
Review childcare, transportation, housing, respite care, legal assistance and financial support for relatives and other caregivers.
Placement Capacity
Determine whether Texas has the right mix of family-based homes, kinship placements, emergency care and higher-acuity services where children actually live.
Data and Accountability
Improve public reporting on placement stability, length of stay, sibling outcomes, permanency, re-entry and provider/service capacity.
“I want DFPS and our community partners to tell us what they need from the Legislature. If a law needs to change, I want to understand why. If funding is the barrier, I want to know where. If providers need additional capacity or flexibility, I want that information before we are on the House floor deciding what Texas will fund for the next two years.” State Rep. Josey Garcia
Garcia’s office is preparing additional requests for background information from DFPS and intends to hear from foster families, kinship caregivers, providers, advocates and young adults with lived foster-care experience as legislative options are developed.